This site uses cookies to provide an optimized shopping experience. By using this site, you agree the use of cookies within our privacy policy.
Tektronix MDO34 3-BW-200
200 MHz, 4-Channel, 2.5 GS/s Mixed Domain Oscilloscope with 8-bit Vertical Resolution and 11.6 in. HD Touchscreen, 10 M
MDO343BW200
MDO34 3-BW-200

Tektronix MDO34 3-BW-200
200 MHz, 4-Channel, 2.5 GS/s Mixed Domain Oscilloscope with 8-bit Vertical Resolution and 11.6 in. HD Touchscreen, 10 M
MDO343BW200
MDO34 3-BW-200
The Tektronix MDO343BW200 Mixed Domain Oscilloscope adds more capability to any bench. With an included spectrum analyzer and separate RF inputs, the MDO34 allows users to quickly debug their designs and track down sources of unwanted EMI emissions, without tracking down a standalone analyzer.
- Number of analog channels: 4
- Bandwidth: 200 MHz
- Sample rate: 2.5 GS/s
- Vertical resolution: 8 bits (11 bits with Hi Res)
- Number of analog channels: 4
- Bandwidth: 200 MHz
- Sample rate: 2.5 GS/s
- Vertical resolution: 8 bits (11 bits with Hi Res)
- Display: 11.6 inch color HD (1920 x 1080) capacitive touchscreen
- Record length: 10 M on all channels
- Maximum waveform capture rate: >280,000 wfm/s
- Standard passive voltage probes with 3.9 pF capacitive loading and 250 MHz analog bandwidth
- Includes Spectrum Analyzer:
- Frequency range: 9 kHz - 1 GHz
- Optional ultra-wide capture bandwidth up to 3 GHz
- Arbitrary Function Generator (optional):
- 13 predefined waveform types
- 50 MHz waveform generation
- 128 k arbitrary generator record length
- 250 MS/s arbitrary generator sample rate
- Digital Channels (optional):
- 16 digital channels
- 10 M record length on all channels
- 121.2 ps timing resolution
- Serial Bus Decode, Triggering and Search (optional):
- Serial bus support for I2C, SPI, RS-232/422/485/UART, USB 2.0, CAN, CAN FD, LIN, FlexRay, MIL-STD-1553, ARINC429, and Audio standards
- Digital Voltmeter / Frequency Counter (requires free product registration):
- 4-digit DC, AC RMS, and DC+AC RMS voltage measurements
- 5-digit frequency measurements
Applications
- Embedded design and IoT: Discover and solve issues quickly by performing system level debug on mixed signal embedded systems including today's most common serial bus technologies for broad set of common serial buses
- Power design: Make reliable and repeatable voltage, current, and power measurements using automated power quality, switching loss, harmonics, ripple, modulation, and safe operating area measurements with wide selection of power probes
- Education: Combination of small instruments and high levels of integration aids in teaching of various electronics principles as well as in its usage for more sophisticated lab experiments; full upgradeability enables adding functionality over time as needs change or budgets allow
- Manufacturing test and troubleshooting: Minimizes rack or bench space by integrating multiple instruments into one small package; integration reduces costs associated with utilizing multiple different instrument types in manufacturing test or troubleshooting stations
- Service installation and maintenance: Combines analog waveforms, digital logic, and spectrum analysis in a lightweight (11.7 lbs, 5.3 kg), portable package; perfect choice where space is limited and flexibility is a must
The Tektronix MDO343BW200 200 MHz, 4-Channel, 2.5 GS/s Mixed Domain Oscilloscope with 8-bit Vertical Resolution and 11.6 in. HD Touchscreen, 10 M Record Length adds more capability to your bench - with an included spectrum analyzer and separate RF inputs, the MDO34 allows you to quickly debug your designs and track down sources of unwanted EMI emissions, without tracking down a standalone analyzer.
Exceptionally easy-to-use user interface lets you focus on the task at hand

Channel Configuration Menu
The Settings Bar - key parameters and waveform management
Waveform and scope operating parameters are displayed in a series of badges in the Settings Bar that runs along the bottom of the display. The Settings Bar provides immediate access for the most common waveform management tasks.
The Results Bar - analysis and measurements
The Results Bar on the right side of the display includes immediate, one tap access to the most common analytical tools such as cursors, measurements, searches and bus decode results tables.
Cursors, measurements and search results badges are displayed in the Results Bar without sacrificing any waveform viewing area. For additional waveform viewing area, the Results Bar can be dismissed and brought back at any time.

Capacitive Touch Display
Touch interaction finally done right
Scopes have included touch screens for years, but the touch screen has been an afterthought. The MDO34 11.6 inch display includes a capacitive touchscreen and provides a user interface truly designed for touch.
The touch interactions that you use with phones and tablets, and expect in a touch enabled device, are supported in the MDO34.
- Drag waveforms left/right or up/down to adjust horizontal and vertical position or to pan a zoomed view
- Pinch and expand to change scale or zoom in/out in either horizontal or vertical directions
- Swipe in from the right to reveal the Results Bar or down from the top to access the menus in the upper left corner of the display
Smooth, responsive front panel controls allow you to make adjustments with familiar knobs and buttons, and you can add a mouse or keyboard as a third interaction method.
Powerful Waveform Capture and Analysis
At the core of the MDO34 is a world-class oscilloscope, offering comprehensive tools that speed each stage of debug - from quickly discovering anomalies and capturing them, to searching your waveform record for events of interest and analyzing their characteristics and your device's behavior.
Digital phosphor technology with FastAcq™ highspeed waveform capture
To debug a design problem, first you must know it exists. Every design engineer spends time looking for problems in their design, a time consuming and frustrating task without the right debug tools.

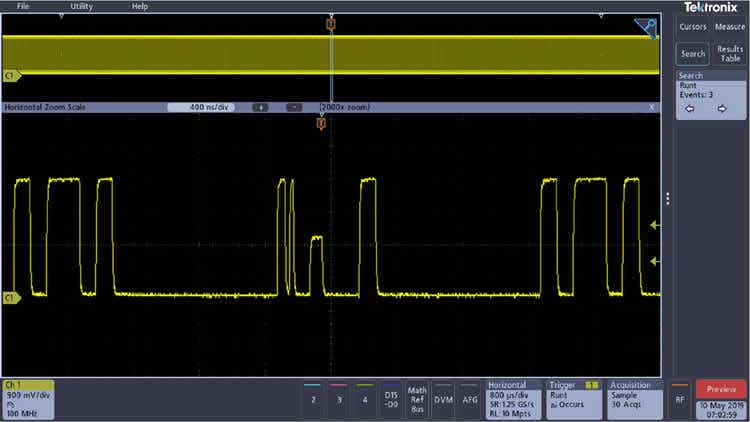
FastAcq Waveform Capture
Digital phosphor technology provides you with fast insight into the real operation of your device. Its fast waveform capture rate - greater than 280,000 wfms/s with FastAcq - gives you a high probability of quickly seeing the infrequent problems common in digital systems: runt pulses, glitches, timing issues, and more.
To further enhance the visibility of rarely occurring events, intensity grading is used to indicate how often rare transients are occurring relative to normal signal characteristics. There are four waveform palettes available in FastAcq acquisition mode.
- The Temperature palette uses color-grading to indicate frequency of occurrence with hot colors like red/yellow indicating frequently occurring events and colder colors like blue/green indicating rarely occurring events.
- The Spectral palette uses color-grading to indicate frequency of occurrence with colder colors like blue indicating frequently occurring events and hot colors like red indicating rarely occurring events.
- The Normal palette uses the default channel color (like yellow for channel one) along with gray-scale to indicate frequency of occurrence where frequently occurring events are bright.
- The Inverted palette uses the default channel color along with grayscale to indicate frequency of occurrence where rarely occurring events are bright.
These color palettes quickly highlight the events that over time occur more often or, in the case of infrequent anomalies, occur less often.
Infinite or variable persistence choices determine how long waveforms stay on the display, helping you to determine how often an anomaly is occurring.

Capturing Events
Triggering
Discovering a device fault is only the first step. Next, you must capture the event of interest to identify root cause. To enable this, the MDO34 contains over 125 trigger combinations providing a complete set of triggers - including runt, logic, pulse width/glitch, setup and hold violation, serial packet, and parallel data - to help quickly locate your event of interest. And with up to a 10 M record length, you can capture many events of interest, even thousands of serial packets, in a single acquisition for further analysis while maintaining high resolution to zoom in on fine signal details.

Automated Measurements
Basic waveform analysis and automated measurements
Verifying that your prototype's performance matches simulations and meets the project's design goals requires careful analysis, ranging from simple checks of rise times and pulse widths to sophisticated power loss analysis, characterization of system clocks, and investigation of noise sources.
The MDO34 offers a comprehensive set of standard analysis tools including:
- Waveform- and screen-based cursors
- Automated measurements
- Basic waveform math
- Basic FFT analysis
- Advanced waveform math with equation editor
Measurement results tables provide comprehensive statistical views of measurement results.
Easy navigation and search
Finding your event of interest in a long waveform record can be time consuming without the right search tools. With today's record lengths of many millions of data points, locating your event can mean scrolling through literally thousands of screens of signal activity.
The MDO34 offers the industry's most comprehensive search and waveform navigation with its innovative on-screen controls. These controls speed panning and zooming through your record. Use intuitive pinch/ expand gestures on the display itself to investigate areas of interest in a long record.
Search Feature
The Search feature allows you to automatically search through your long acquisition looking for user-defined events. All occurrences of the event are highlighted with search marks and are easily navigated to, using the Previous ( ← ) and Next ( → ) buttons found on the Search badge on the display. Search types include edge, pulse width, timeout, runt, logic, setup and hold, rise/fall time and parallel/serial bus packet content.
Comprehensive power analysis (option 3-PWR)

Power Quality Measurement Table
Ever increasing consumer demands for longer battery-life devices and for green solutions that consume less power require power-supply designers to characterize and minimize switching losses to improve efficiency. In addition, the supply's power levels, output purity, and harmonic feedback into the power line must be characterized to comply with national and regional power quality standards. Historically, making these and many other power measurements on an oscilloscope has been a long, manual, and tedious process. The MDO34 optional power analysis tools greatly simplify these tasks, enabling quick, repeatable and accurate analysis of power quality, switching loss, harmonics, safe operating area (SOA), modulation, ripple, and slew rate (di/dt, dv/dt). Completely integrated into the oscilloscope, the power analysis tools provide automated, repeatable power measurements with a touch of a button. The optional power analysis functionality is offered free for a 30-day trial period. This free trial period starts automatically when the instrument is powered on for the first time.
Unique Built-In Spectrum Analyzer
The Tektronix MDO series is the only oscilloscope to offer an integrated, hardware-based spectrum analyzer. The spectrum analyzer frequency range of the MDO34 is from 9 kHz to 1 GHz (optional 3GHz extension available), enabling spectral analysis on IoT and most consumer wireless standards.
Frequency Domain Display
Fast and accurate spectral analysis
When using the spectrum analyzer standard N-connector input, the MDO34 display becomes a full-screen Spectrum Analyzer view.
Key spectral parameters such as Center Frequency, Span, Reference Level, and Resolution Bandwidth are all adjusted quickly and easily using on-screen touch controls.
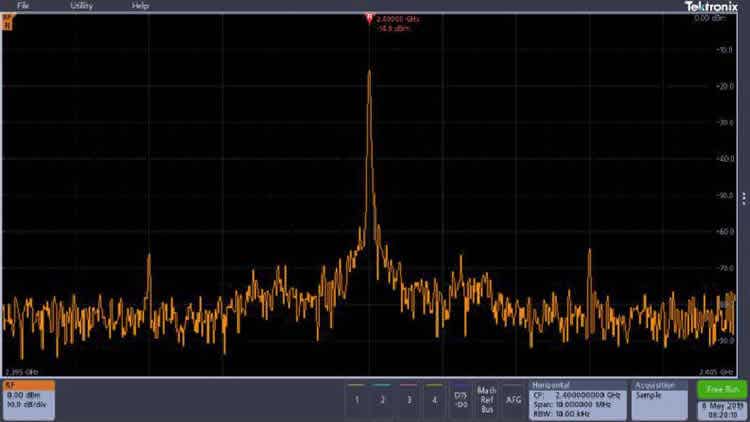
Intelligent efficient markers
In a traditional spectrum analyzer, it can be a very tedious task to turn on and place enough markers to identify all your peaks of interest. The MDO34 makes this process far more efficient by automatically placing markers on peaks that indicate both the frequency and the amplitude of each peak. You can adjust the criteria that the oscilloscope uses to automatically find the peaks.
The highest amplitude peak is referred to as the reference marker and is shown in red. Marker readouts can be switched between Absolute and Delta readouts. When Delta is selected, marker readouts show each peak's delta frequency and delta amplitude from the reference marker.

Automated Peak Markers
Two manual cursors are also available for measuring non-peak portions of the spectrum. When enabled, the reference marker is attached to one of the cursors, enabling delta measurements from anywhere in the spectrum. In addition to frequency and amplitude, cursor readouts also include noise density and phase noise readouts depending on whether Absolute or Delta readouts are selected. A "Reference Marker to Center" function instantly moves the frequency indicated by the reference marker to center frequency.
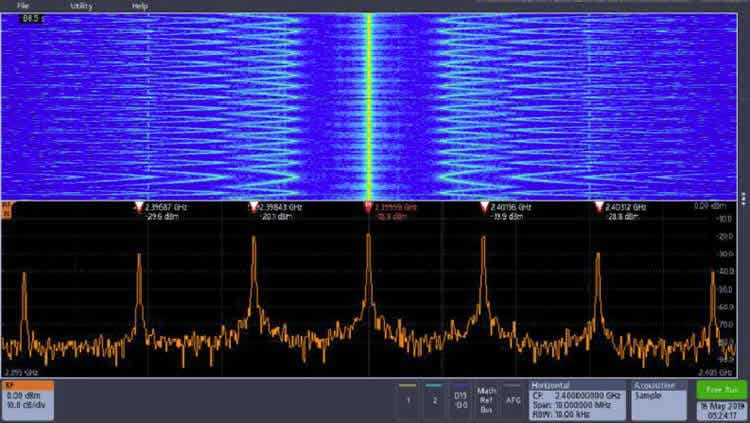
Spectrogram
The MDO34 includes a spectrogram display which is ideal for monitoring slowly changing RF phenomena. The x-axis represents frequency, just like a typical spectrum display. However, the y-axis represents time, and color is used to indicate amplitude.
Spectrogram slices are generated by taking each spectrum and "flipping it up on its edge" so that it's one pixel row tall, and then assigning colors to each pixel based on the amplitude at that frequency. Cold colors (blue, green) are low amplitude and hotter colors (yellow, red) are higher amplitude. Each new acquisition adds another slice at the bottom of the spectrogram and the history moves up one row. When acquisitions are stopped, you can scroll back through the spectrogram to look at any individual spectrum slice.
Spectrogram Display

Spectral Display

Spectrum Traces
Ultra-wide capture bandwidth
Today's wireless communications vary significantly with time, using sophisticated digital modulation schemes and, often, transmission techniques that involve bursting the output. These modulation schemes can have very wide bandwidth as well. Traditional swept or stepped spectrum analyzers are ill equipped to view these types of signals as they are only able to look at a small portion of the spectrum at any one time.
The amount of spectrum acquired in one acquisition is called the capture bandwidth. Traditional spectrum analyzers sweep or step the capture bandwidth through the desired span to build the requested image. As a result, while the spectrum analyzer is acquiring one portion of the spectrum, the event you care about may be happening in another portion of the spectrum. Most spectrum analyzers on the market today have 10 MHz capture bandwidths, sometimes with expensive options to extend that to 20, 40, or even 160 MHz in some cases.
In order to address the bandwidth requirements of modern RF, the MDO34 provides up to 3 GHz of capture bandwidth. The spectrum is generated from a single acquisition, thus guaranteeing you'll see the events you're looking for in the frequency domain.
Spectrum traces
The MDO34 spectrum analyzer offers four different traces or views including Normal, Average, Max Hold, and Min Hold.
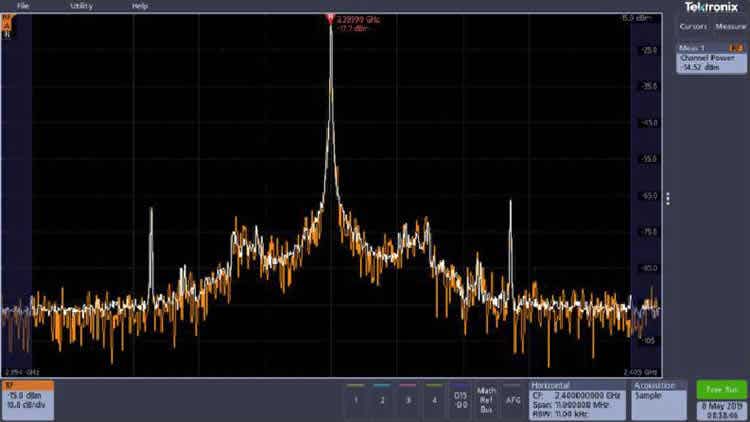
Automated Channel Power Measurement
RF measurements
The MDO34 includes three automated RF measurements - Channel Power, Adjacent Channel Power Ratio, and Occupied Bandwidth. When one of these RF measurements is activated, the oscilloscope automatically turns on the Average spectrum trace and sets the detection method to Average for optimal measurement results.
RF probing
Signal input methods on spectrum analyzers are typically limited to cabled connections or antennas. In addition to using the standard N-connector, the MDO34 Spectrum Analyzer can use 50 Ω TekVPI probes with the optional TPA-N-VPI adapter. This enables additional flexibility when hunting for noise sources and enables easier spectral analysis by using true signal browsing on a spectrum analyzer input.
In addition, an optional preamplifier accessory assists in the investigation of lower-amplitude signals. The TPA-N-PRE preamplifier provides 10 dB nominal gain across the 9 kHz - 3 GHz frequency range.
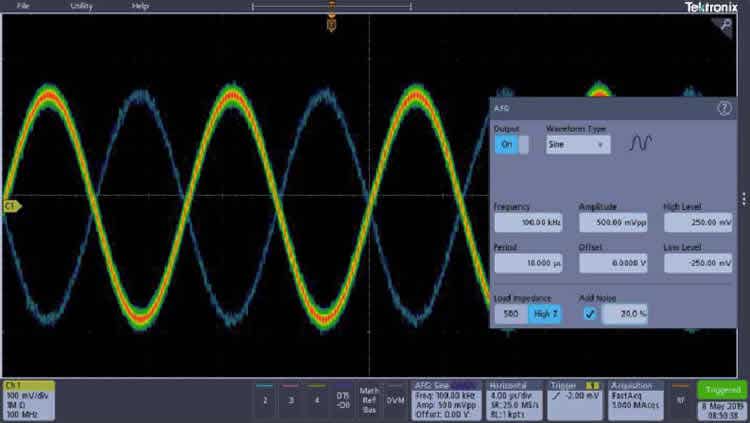
Arbitrary Function Generator (Option 3-AFG)

Waveform Type Selection
The MDO34 contains an optional integrated arbitrary function generator (option 3-AFG), perfect for simulating sensor signals within a design or adding noise to signals to perform margin testing.
The integrated function generator provides output of predefined waveforms up to 50 MHz for sine, square, pulse, ramp/triangle, DC, noise, sin(x)/x (Sinc), Gaussian, Lorentz, exponential rise/fall, Haversine and cardiac.
Flexible Settings
The arbitrary waveform generator provides 128 k points of record for storing waveforms from the analog input, a saved internal file location, a USB mass storage device, or from an external PC. Transfer waveform files to your MDO34 edit memory via USB or LAN or using a USB mass storage device to be output from the AFG in the oscilloscope.
Digital Channels (Option 3-MSO)

View Analog and Digital Signals
The logic analyzer (option 3-MSO) provides 16 digital channels which are tightly integrated into the oscilloscope's user interface. This simplifies operation and makes it possible to solve mixed-signal issues easily.
Color-coded digital waveform display
Color-coded digital traces display ones in green and zeros in blue. This coloring is also used in the digital channel monitor. The monitor shows if signals are high, low, or are transitioning so you can see channel activity at a glance without having to clutter your display with unneeded digital waveforms.
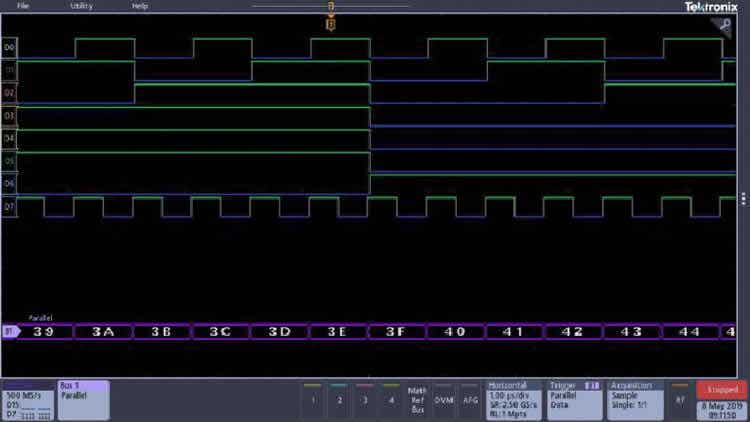
Color-Coded Display
The multiple transition detection hardware shows you a white edge on the display when the system detects multiple transitions. White edges indicate that more information is available by zooming in or acquiring at faster sampling rates. In most cases zooming in will reveal the pulse that was not viewable with the previous settings. If the white edge is still present after zooming in as far as possible, this indicates that increasing the sample rate on the next acquisition will reveal higher frequency information than the previous settings could acquire.
You can group digital waveforms and enter waveform labels easily on the touchscreen. By simply placing digital waveforms next to each other, they form a group. Once a group is formed, you can position all the channels contained in that group collectively. This greatly reduces the normal setup time associated with positioning channels individually
MagniVu™ high-speed acquisition
The main digital acquisition mode on the MDO34 will capture up to 10 M at 500 MS/s (2 ns resolution). In addition to the main record, the MDO34 provides an ultra high-resolution record called MagniVu which acquires 10,000 points at up to 8.25 GS/s (121.2 ps resolution). Both main and MagniVu waveforms are acquired on every trigger and can be switched between in the display at any time, running or stopped. MagniVu provides significantly finer timing resolution than comparable oscilloscopes on the market, instilling confidence when making critical timing measurements on digital waveforms.

P6316 Optional Probe
P6316 MSO probe (option 3-MSO)
This unique probe design offers two eight-channel pods, simplifying the process of connecting to the device-under-test. When connecting to square pins, the P6316 can connect directly to 8×2 square pin headers spaced on tenth-inch centers. When more attachment flexibility is required, you can use the included flying lead sets and grabbers to clip onto surface mount devices or test points. The P6316 offers outstanding electrical characteristics applying only 8 pF of capacitive loading with 101 kΩ input impedance.
Serial Protocol Triggering and Analysis (See Options Below)
- Option 3-SREMBD technologies:
- Embedded - I2C, SPI
- Computer - RS232/422/485, UART
- Option 3-SRUSB2 technologies:
- USB - USB LS, FS, HS
- Options 3-SRAUTO technologies:
- Automotive - CAN, CAN FD, LIN, FlexRay
- Option 3-SRAERO technologies:
- Military and Aerospace - MIL-STD-1553, ARINC429
- Option 3-SRAUDIO technologies:
- Audio - I2S, LJ, RJ, TDM

Triggering
On a serial bus, a single signal often includes address, control, data, and clock information. This can make isolating events of interest difficult. Automatic trigger, decode, and search on bus events and conditions gives you a robust set of tools for debugging serial buses. The optional serial protocol triggering and analysis functionality is offered free for a 30-day trial period. This free trial period starts automatically when the instrument is powered on for the first time.
Serial triggering
Trigger on packet content such as start of packet, specific addresses, specific data content, unique identifiers, etc. on popular serial interfaces such as I2C, SPI, RS-232/422/485/UART, USB2.0, CAN, CAN FD, LIN, FlexRay, MIL-STD-1553, ARINC429, and I2S/LJ/RJ/TDM.
Bus display
Provides a higher-level, combined view of the individual signals (clock, data, chip enable, etc.) that make up your bus, making it easy to identify where packets begin and end and identifying sub-packet components such as address, data, identifier, CRC, etc.
Bus decoding
Tired of having to visually inspect the waveform to count clocks, determine if each bit is a 1 or a 0, combine bits into bytes, and determine the hex value? Let the oscilloscope do it for you! Once you've set up a bus, the MDO34 will decode each packet on the bus, and display the value in hex, binary, decimal (USB, CAN, CAN FD, LIN, FlexRay, MIL-STD-1553, and ARINC429 only), signed decimal (I2S/LJ/RJ/TDM only), or ASCII (USB, MIL-STD-1553 and RS-232/422/485/UART only) in the bus waveform.
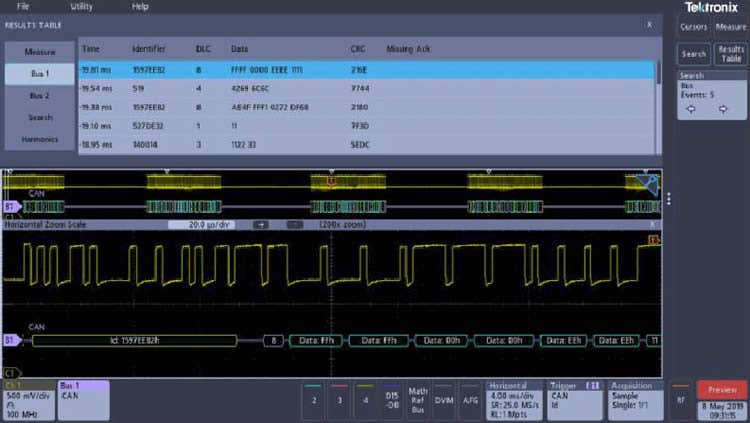
Event table
Event table
In addition to seeing decoded packet data on the bus waveform itself, you can view all captured packets in a tabular view much like you would see in a software listing. Packets are time stamped and listed consecutively with columns for each component (Address, Data, etc.). You can save the event table data in .CSV format.
Search (serial triggering)
Serial triggering is very useful for isolating the event of interest, but once you've captured it and need to analyze the surrounding data, what do you do? In the past, users had to manually scroll through the waveform counting and converting bits and looking for what caused the event. You can have the oscilloscope automatically search through the acquired data for user-defined criteria including serial packet content. Each occurrence is highlighted by a search mark. Rapid navigation between marks is as simple as pressing the Previous (←) and Next (→) buttons on the screen.
| Country of Origin | Singapore |
|---|---|
| Brand | Tektronix |
| Condition | NEW |
- 1 - 200 MHz, 4-Channel, 2.5 GS/s Mixed Domain Oscilloscope with 8-bit Vertical Resolution and 11.6 in. HD Touchscreen, 10 M Record Length
- 4 - TPP0250, 250 MHz, 10X, 3.9 pF Passive Voltage Probes
- 1 - Accessory Bag (016-2144-xx)
- 1 - Power Cord
- 1 - OpenChoice® Desktop Software (Available for Download)
- 1 - Calibration Certificate
- 1 - User Manual (071-3608-00)
- 1 - Three-year Warranty Covering All Parts and Labor on 3 Series MDO Instrument
- 1 - One-year Warranty Covering All Parts and Labor on Included Probes
Customers Also Bought

Tektronix A622 100 kHz, 50 mA-100 A, BNC AC/DC Current Probe
$1,263.50 Price $1,330.00