This site uses cookies to provide an optimized shopping experience. By using this site, you agree the use of cookies within our privacy policy.
Refurbished Catalog
 AGILENT (Used) 11867A RF Limiter, DC to 1800 MHz, RefurbishedModel No. 11867ACatalog No. 11867ALog in for member pricing
- Agilent / HP 1250-0080 BNC Adapter, RefurbishedModel No. 12500080Catalog No. 12500080Log in for member pricing
- Agilent / HP 16008B Resistivity Cell, RefurbishedModel No. 16008B-UCatalog No. 16008BLog in for member pricing
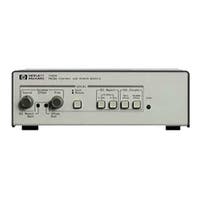
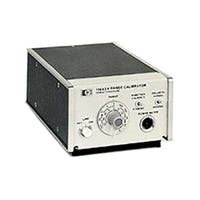 Keysight / Agilent / HP 11683A Power Meter Range Calibrator (for EPM series, EPM-P series, E1416A, 70100A, 43X), RefurbishedModel No. 11683ACatalog No. 11683ALog in for member pricing
- Keysight / Agilent / HP E1740A Time Interval Analyzer Module, RefurbishedModel No. E1740ACatalog No. E1740ALog in for member pricing
- Keysight / Agilent / HP E1401B C-Size VXI, High-Power Mainframe, 13-Slot, RefurbishedModel No. E1401BLog in for member pricing
- Keysight / Agilent / HP E1460A 64-Channel Relay Multiplexer, RefurbishedModel No. E1460ALog in for member pricing