This site uses cookies to provide an optimized shopping experience. By using this site, you agree the use of cookies within our privacy policy.
Tektronix DPO2002B
70 MHz, 2-Channel, 1 GS/s Digital Phosphor Oscilloscope
DPO2002B
DPO2002B

Tektronix DPO2002B
70 MHz, 2-Channel, 1 GS/s Digital Phosphor Oscilloscope
DPO2002B
DPO2002B

- Bandwidth: 70 MHz
- Number of Channels: 2
- Sample Rate: 1 GS/s
- 1 Megapoint record length (on all channels)
- 5,000 wfm/s maximum waveform capture rate
- Suite of advanced triggers
- Wave inspector controls provide easy navigation and automated search of waveform data
- Automated serial triggering, decode, and search options for I2C, SPI, CAN, LIN, and RS-232/422/485/UART
- FilterVu variable low-pass filter allows for removal of unwanted signal noise while simultaneously capturing high-frequency events
- 29 automated measurements, and FFT analysis for simplified waveform analysis
- TekVPI Probe Interface supports active, differential, and current probes for automatic scaling and units
- 7 in. (180mm) widescreen TFT-LCD color display
- USB 2.0 host port on front panel for quick and easy data storage
- USB 2.0 device port on rear panel for easy connection to PC or direct printing to a PictBridge-compatible printer
- Optional 10/100 ethernet port for network connection and video out port to export oscilloscope display to monitor or projector
- Small footprint and lightweight
- Dimensions: 5.3 in. (134mm) deep
- Weight: 7 lb. 14 oz. (3.6 kg)
The Tekronix DPO2002B 70 MHz, 2-Channel, 1GS/s Digital Phosphor Oscilloscope offers a robust set of features to speed every stage of debugging your design, from quickly discovering an anomaly and capturing it, to searching your waveform record for the event and analyzing its characteristics and your device's behavior.

Discover
Discover
To debug a design problem, first you must know it exists. Every design engineer spends time looking for problems in their design, a time-consuming and frustrating task without the right debug tools.
The DPO2002B offers complete visualization of signals, providing fast insight into the real operation of your device. A waveform capture rate of 5,000 waveforms per second enables you to see glitches and other infrequent transients quickly, revealing the true nature of device faults. A digital phosphor display with intensity grading shows the history of a signal's activity by intensifying areas of the signal that occur more frequently, providing a visual display of just how often anomalies occur.

Capture
Capture
Discovering a device fault is only the first step. Next, you must capture the event of interest to identify root cause.
The DPO2002B provides a complete set of triggers, including runt, logic, pulse width/glitch, setup/hold violation, serial packet, and parallel data to help quickly find your event. With up to a 1 Mpoint record length, you can capture many events of interest, even thousands of serial packets, in a single acquisition for further analysis while maintaining high resolution to zoom in on fine signal details.
From triggering on specific packet content to automatic decode in multiple data formats, the DPO2002B provides integrated support for a broad range of serial buses: I2C, SPI, CAN, LIN, and RS-232/422/485/ UART. The ability to decode up to two serial and/or parallel buses simultaneously means you gain insight into system-level problems quickly.

Search
Search
Finding your event of interest in a long waveform record can be time consuming without the right search tools. With today's record lengths pushing to a million data points, locating your event can mean scrolling through thousands of screens of signal activity.
The DPO2002B offers the industry's most comprehensive search and waveform navigation with its innovative Wave Inspector controls. These controls speed up panning and zooming through your record. A unique force-feedback system lets you move from one end of your record to the other in just seconds. You can mark any location you may want to reference later for further investigation, and automatically search the record using criteria that you define. Wave Inspector will instantly search your entire record, including analog, digital, and serial bus data. Along the way, it will automatically mark every occurrence of your defined event so you can quickly move between events.

Analyze
Analyze
Verifying that your prototype's performance matches simulations and meets the project's design goals requires analyzing its behavior. Tasks can range from simple checks of rise times and pulse widths to sophisticated power loss analysis and investigation of noise sources.
The DPO2002B offers a comprehensive set of integrated analysis tools including waveform and screen-based cursors, 29 automated measurements, and FFT analysis. Specialized application support for serial bus analysis is also available.
Wave Inspector Navigation and Search
A 1M point record length represents thousands of screens of information. The DPO2002B enables you to search through it all and find your event in seconds with Wave Inspector, the industry's best tool for navigation and search.
Zoom/Pan
A dedicated, two-tier front-panel control provides intuitive control of both zooming and panning. The inner control adjusts the zoom factor (or zoom scale); turning it clockwise activates zoom and goes to progressively higher zoom factors, while turning it counterclockwise results in lower zoom factors and eventually turning zoom off. No longer do you need to navigate through multiple menus to adjust your zoom view. The outer control pans the zoom box across the waveform to quickly get to the portion of waveform you are interested in. The outer control also utilizes force-feedback to determine how fast to pan on the waveform. The farther you turn the outer control, the faster the zoom box moves. Pan direction is changed by simply turning the control the other way.

Wave Inspector Controls
Play/Pause
A dedicated play/pause front-panel button scrolls the waveform across the display automatically while you look for anomalies or an event of interest. Playback speed and direction are controlled using the intuitive pan control. Once again, turning the control further makes the waveform scroll faster and changing direction is as simple as turning the control the other way.
User Marks
Press the Set Mark front-panel button to place one or more marks on the waveform. Navigating between marks is as simple as pressing the Previous (←) and Next (→) buttons on the front panel.

Search Step 1
Search Marks
The Search button allows you to automatically search through your long acquisition looking for user-defined events. All occurrences of the event are highlighted with search marks and are easily navigated to, using the frontpanel Previous (←) and Next (→) buttons. Search types include edge, pulse width/glitch, runt, logic, setup and hold, rise/fall time parallel bus, and I2C, SPI, CAN, LIN, and RS-232/422/485/UART packet content.

Search Step 2
Digital Phosphor Technology
The DPO2002B's digital phosphor technology provides you with fast insight into the real operation of your device. Its waveform capture rate of 5,000 wfm/s gives you a high probability of quickly seeing the infrequent problems common in digital systems: runt pulses, glitches, timing issues, and more.

Digital Phosphor Technology
Waveforms are superimposed with one another and waveform points that occur more frequently are intensified. This quickly highlights the events that over time occur more often or, in the case of infrequent anomalies, occur less often.
With the DPO2002B, you can choose infinite persistence or variable persistence, determining how long the previous waveform acquisitions stay on-screen. This allows you to determine how often an anomaly is occurring.
The multiple transition detection hardware of the DPO2002B will show you a white edge on the display when the system detects multiple transitions. This acts as a visual reminder that increasing the sample rate on the next acquisition will reveal higher frequency information than your previous settings could acquire.
The DPO2002B simplifies channel setup by allowing you to group digital waveforms and enter waveform labels by using a USB keyboard. By simply placing digital waveforms next to each other, they form a group. Once a group is formed, you can position all the channels contained in that group collectively. This greatly reduces the normal setup time associated with positioning channels individually.
FilterVu Variable Low-Pass Filter
Tired of being limited to a 20 MHz bandwidth filter in your oscilloscope? Simply turn on FilterVu and adjust the variable low-pass noise filter. Unlike other variable low-pass filters, FilterVu filters out the unwanted noise from your signal while still capturing glitches and other signal details up to the full bandwidth of the oscilloscope. It does this by showing two waveforms: a waveform that can be filtered (foreground waveform) and a glitch capture waveform (background waveform).

Output of DAC Signal
The filtered waveform uses a variable low-pass filter to block out noise, yielding a cleaner waveform to more precisely locate signal edges and amplitude levels. The result is improved confidence in you cursor measurements and cleaner documentation of important signal attributes. When the noise filter is adjusted to the lowest available noise-cutoff frequency, no more than 1% of high-frequency content that could cause the oscilloscope to alias will pass through the filter.
The glitch capture waveform shows signal details up to the full bandwidth of the oscilloscope. The oscilloscope captures pulses as narrow as 5 ns, using peak-detect min/max sampling, protecting you from missing unexpected glitches or other high-frequency events.
FilterVu is ideal for repetitive, nonrepetitive, and single-shot events.
Serial Triggering and Analysis (Optional)
On a serial bus, a single signal often includes address, control, data, and clock information. This can make isolating events of interest difficult. Automatic trigger, decode, and search on bus events and conditions gives you a robust set of tools for debugging serial buses. The optional serial protocol triggering and analysis functionality is offered free for a 30-day trial period. This free trial period starts automatically when the instrument is powered on for the first time.

Serial Triggering
Serial Triggering
Trigger on packet content such as start of packet, specific addresses, specific data content, unique identifiers, etc. on popular serial interfaces such as I2C, SPI, CAN, LIN, and RS-232/422/485/UART.
Bus Display
Provides a higher-level, combined view of the individual signals (clock, data, chip enable, etc.) that make up your bus, making it easy to identify where packets begin and end and identifying subpacket components such as address, data, identifier, CRC, etc.
Bus Decoding
Tired of having to visually inspect the waveform to count clocks, determine if each bit is a 1 or a 0, combine bits into bytes, and determine the hex value? Let the oscilloscope do it for you! Once you've set up a bus, the DPO2002B will decode each packet on the bus, and display the value in hex, binary, decimal (LIN only), or ASCII (RS-232/422/485/ UART only) in the bus waveform.

Event Table
Event Table
In addition to seeing decoded packet data on the bus waveform itself, you can view all captured packets in a tabular view much like you would see in a software listing. Packets are time stamped and listed consecutively with columns for each component (Address, Data, etc.).
Search
Serial triggering is very useful for isolating the event of interest, but once you've captured it and need to analyze the surrounding data, what do you do? In the past, users had to manually scroll through the waveform counting and converting bits and looking for what caused the event. With the DPO2002B, you can have the oscilloscope automatically search through the acquired data for user-defined criteria including serial packet content. Each occurrence is highlighted by a search mark. Rapid navigation between marks is as simple as pressing the Previous (←) and Next (→) buttons on the front panel.
The DPO2002B is designed to make your work easier. The bright, widescreen display shows a long time window. Dedicated front-panel controls simplify operation. A USB host port on the front panel allows you to easily transfer screenshots, instrument settings, and waveform data to a USB flash drive.
Bright, Widescreen Display
The DPO2002B features a 7 inch (180 mm) widescreen, TFTLCD display for seeing intricate signal details.
Dedicated Front-Panel Controls
Per-channel vertical controls provide simple and intuitive operation. No longer do you need to share one set of vertical controls across all four channels.
Connectivity
A USB host port on the front panel enables easy transfer of screenshots, instrument settings, and waveform data to a USB thumb drive. The rear panel contains a USB device port for controlling the oscilloscope remotely from a PC or for connecting a USB keyboard. The USB device port can also be used to print directly to a PictBridge-compatible printer. An optional 10/100 Ethernet port enables easy connection to networks and an optional Video Out port allows the oscilloscope display to be exported to an external monitor or projector.
Compact Form Factor
A compact, portable form factor allows the DPO2002B to be easily moved between labs and, with a depth of just 5.3 inches (134 mm), it saves you valuable space on your test bench.
TekVPI Probe Interface
The TekVPI probe interface sets the standard for ease of use in probing. TekVPI probes feature status indicators and controls, as well as a probe menu button right on the comp box itself. This button brings up a probe menu on the oscilloscope display with all relevant settings and controls for the probe. TekVPI probes can be controlled remotely through USB, GPIB, or Ethernet, enabling more versatile solutions in ATE environments.

OpenChoice Desktop Software
Extended Analysis
Acquiring data and measurements from the DPO2002B is as simple as connecting a USB cable from the oscilloscope to your PC. Key software applications - OpenChoice Desktop, and Microsoft Excel and Word toolbars - are included standard with each oscilloscope to enable fast and easy direct communication with your Windows PC.
For simple tasks, the included OpenChoice Desktop enables fast and easy communication between the oscilloscope and your PC through USB, GPIB, or LAN for transferring settings, waveforms, and screen images.
| Country of Origin | China |
|---|---|
| Brand | Tektronix |
| Condition | NEW |
| Vendor Alias | TEK-DPO2002B |
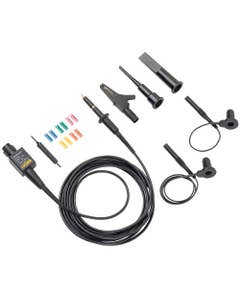
- 2 - 100 MHz, 10X Passive Voltage Probes (TPP0100)
- 1 - Translated Front-Panel Overlay
- 1 - OpenChoice Desktop Software
- 1 - Calibration Certificates Document
- 1 - Quality System Registration
- 1 - Power Cord
- 1 - User Manual
Customers Also Bought
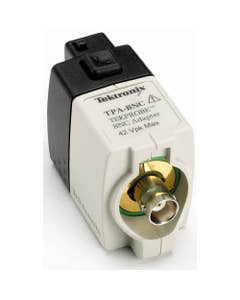
Tektronix TPA-BNC TekVPI to TekProbe BNC adapter
$771.40 Price $812.00